

1. 調査手法および範囲
1.1. 調査手法
1.2. 調査目的およびレポートの範囲
2. 定義および概要
3. エグゼクティブサマリー
3.1. 画像診断法による抜粋
3.2. 導入形態による抜粋
3.3. 用途による抜粋
3.4. エンドユーザーによる抜粋
3.5. 地域別
4. ダイナミクス
4.1. 影響因子
4.1.1. 推進要因
4.1.1.1. 高齢者人口の増加
4.1.1.2. 迅速な分析と意思決定
4.1.2. 抑制要因
4.1.2.1. データプライバシーとセキュリティに関する懸念
4.1.3. 機会
4.1.4. 影響分析
5. 産業分析
5.1. ポーターのファイブフォース分析
5.2. サプライチェーン分析
5.3. 価格分析
5.4. 特許分析
5.5. 規制分析
5.6. SWOT分析
5.7. 未充足ニーズ
6. 画像診断法別
6.1. はじめに
6.1.1. 市場規模分析および前年比成長率(%)別、画像診断法別
6.1.2. 市場魅力度指数、画像診断法別
6.2. X線画像*
6.2.1. はじめに
6.2.2. 市場規模分析および前年比成長率(%)別
6.3. 磁気共鳴画像法(MRI)
6.4. コンピュータ断層撮影(CT)
6.5. 超音波画像診断
6.6. マンモグラフィ
6.7. その他
7. 導入形態別
7.1. はじめに
7.1.1. 導入形態別市場規模分析および前年比成長率(%)
7.1.2. 導入形態別 市場魅力度指数
7.2. クラウドベースソリューション*
7.2.1. はじめに
7.2.2. 市場規模分析および前年比成長率分析(%)
7.3. オンプレミスソリューション
7.4. ハイブリッドモデル
8. 用途別
8.1. はじめに
8.1.1. 用途別市場規模分析および前年比成長率(%)
8.1.2. 用途別市場魅力度指数
8.2. 腫瘍学*
8.2.1. 概要
8.2.2. 市場規模分析および前年比成長率(%)
8.3. 循環器学
8.4. 神経学
8.5. 呼吸器疾患
8.6. 整形外科
8.7. 消化器科
8.8. その他
9. エンドユーザー別
9.1. はじめに
9.1.1. エンドユーザー別市場規模分析および前年比成長率(%)
9.1.2. エンドユーザー別市場魅力度指数
9.2. 病院*
9.2.1. 概要
9.2.2. 市場規模分析および前年比成長率分析(%)
9.3. 診断センター
9.4. 専門クリニック
9.5. 学術・研究機関
10. 地域別
10.1. 概要
10.1.1. 市場規模分析および前年比成長率分析(%)、地域別
10.1.2. 市場魅力度指数、地域別
10.2. 北米
10.2.1. はじめに
10.2.2. 主な地域特有の動向
10.2.3. 市場規模分析および前年比成長率分析(%)、画像モダリティ別
10.2.4. 導入形態別市場規模分析および前年比成長率(%)
10.2.5. 用途別市場規模分析および前年比成長率(%)
10.2.6. エンドユーザー別市場規模分析および前年比成長率(%)
10.2.7. 国別市場規模分析および前年比成長率(%)
10.2.7.1. 米国
10.2.7.2. カナダ
10.2.7.3. メキシコ
10.3. ヨーロッパ
10.3.1. はじめに
10.3.2. 主要地域特有の動向
10.3.3. 画像モダリティ別市場規模分析および前年比成長率分析(%)
10.3.4. 導入形態別市場規模分析および前年比成長率(%)
10.3.5. 用途別市場規模分析および前年比成長率(%)
10.3.6. エンドユーザー別市場規模分析および前年比成長率(%)
10.3.7. 国別市場規模分析および前年比成長率(%)
10.3.7.1. ドイツ
10.3.7.2. 英国
10.3.7.3. フランス
10.3.7.4. スペイン
10.3.7.5. イタリア
10.3.7.6. ヨーロッパのその他地域
10.4. 南アメリカ
10.4.1. はじめに
10.4.2. 主要地域別の動向
10.4.3. 市場規模分析および前年比成長率分析(%)、画像モダリティ別
10.4.4. 市場規模分析および前年比成長率分析(%)、導入形態別
10.4.5. 市場規模分析および前年比成長率分析(%)、用途別
10.4.6. エンドユーザー別市場規模分析および前年比成長率(%)
10.4.7. 国別市場規模分析および前年比成長率(%)
10.4.7.1. ブラジル
10.4.7.2. アルゼンチン
10.4.7.3. 南米その他
10.5. アジア太平洋
10.5.1. はじめに
10.5.2. 主要地域別の動向
10.5.3. 画像モダリティ別市場規模分析および前年比成長率分析(%)
10.5.4. 導入形態別市場規模分析および前年比成長率分析(%)
10.5.5. 用途別市場規模分析および前年比成長率分析(%)
10.5.6. エンドユーザー別市場規模分析および前年比成長率(%)
10.5.7. 国別市場規模分析および前年比成長率(%)
10.5.7.1. 中国
10.5.7.2. インド
10.5.7.3. 日本
10.5.7.4. 韓国
10.5.7.5. アジア太平洋地域その他
10.6. 中東およびアフリカ
10.6.1. はじめに
10.6.2. 主要地域特有の動向
10.6.3. 画像診断モダリティ別市場規模分析および前年比成長率(%)
10.6.4. 導入形態別市場規模分析および前年比成長率(%)
10.6.5. 用途別市場規模分析および前年比成長率(%)
10.6.6. エンドユーザー別市場規模分析および前年比成長率(%)
11. 競合状況
11.1. 競合シナリオ
11.2. 市場ポジショニング/シェア分析
11.3. 合併・買収分析
12. 企業プロフィール
deepc GmbH
Qure.ai Technologies Private Limited
DeepTek.ai, Inc
Aidoc
Tempus AI, Inc.
Rayscape
Infervision
AIKENIST
Rad AI
Brainomix Limited
リストは網羅的なものではありません。
13. 付録
13.1. 当社およびサービスについて
13.2. お問い合わせ
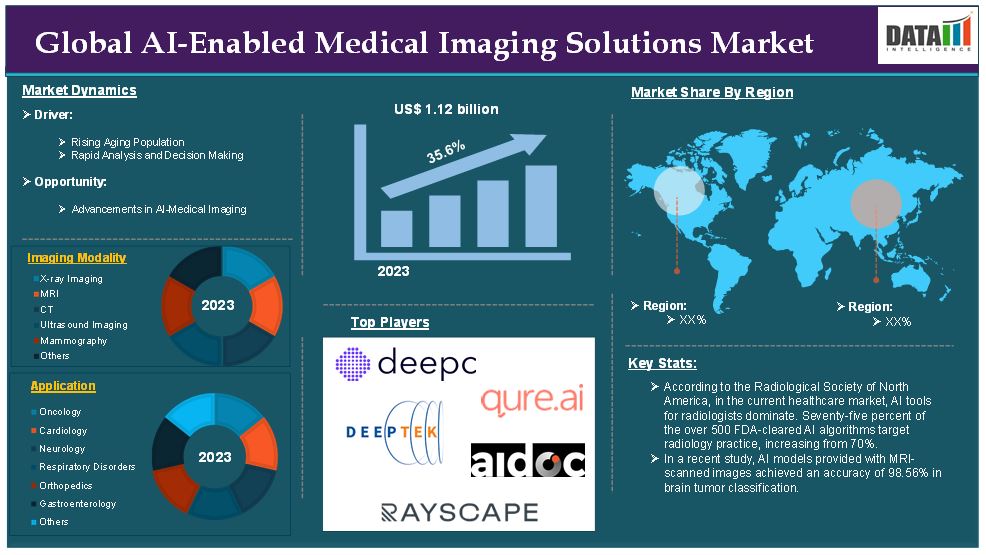
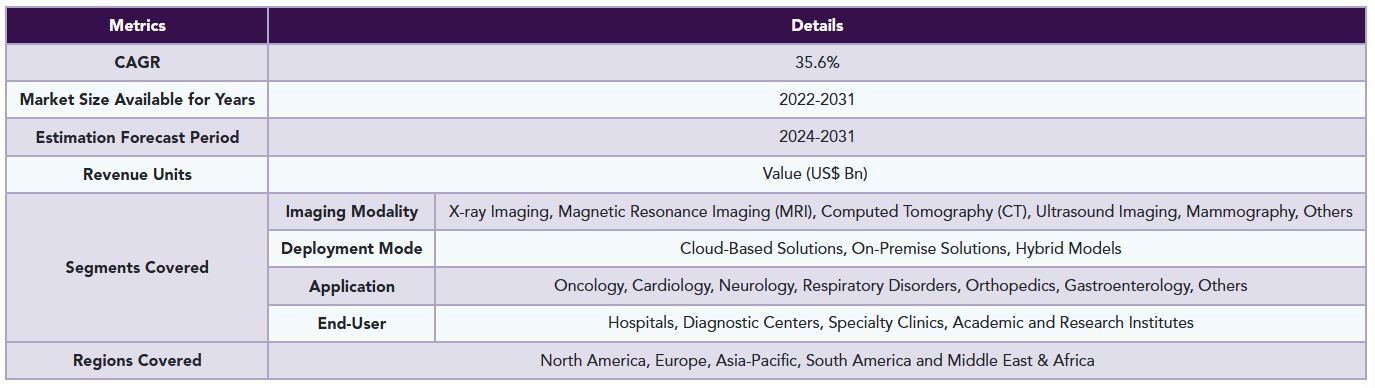
The global AI-enabled medical imaging solutions market reached US$ 1.12 billion in 2023 and is expected to reach US$ 12.64 billion by 2031, growing at a CAGR of 35.6% during the forecast period 2024-2031.
AI-enabled medical imaging solutions refer to the integration of artificial intelligence (AI) technologies into the field of medical imaging to enhance the process of capturing, analyzing, interpreting and reporting diagnostic images. These solutions utilize advanced AI algorithms, including machine learning (ML), deep learning (DL), natural language processing (NLP) and computer vision to automate and improve various aspects of medical imaging workflows, such as image enhancement, segmentation, interpretation and decision support.
The market demand for AI-enabled medical imaging solutions is growing rapidly due to technological advancements, increasing healthcare needs and a growing preference for Artificial Intelligence in radiology. For instance, according to the Radiological Society of North America, in the current healthcare market, AI tools for radiologists dominate. Seventy-five percent of the over 500 FDA-cleared AI algorithms target radiology practice, increasing from 70%.
Market Dynamics: Drivers & Restraints
Rising aging population
The rising aging population is significantly driving the growth of the AI-enabled medical imaging solutions market and is expected to drive the market over the forecast period. As the global population ages, the prevalence of age-related diseases like cancer, cardiovascular conditions, neurodegenerative diseases and musculoskeletal disorders rises. These conditions require frequent monitoring, early detection and accurate diagnosis, which can be achieved more efficiently with AI-enabled imaging solutions.
AI algorithms can assist radiologists in analyzing medical images more accurately and swiftly, reducing human error and providing quicker diagnosis. Given that elderly patients often have multiple health conditions that need to be evaluated at once, AI’s ability to prioritize, analyze, and interpret complex medical images is crucial for improving patient outcomes.
For instance, according to the World Health Organization, by 2030, 1 in 6 people in the world will be aged 60 years or over. At this time, the share of the population aged 60 years and over will increase from 1 billion in 2020 to 1.4 billion. By 2050, the world’s population of people aged 60 years and older will double (2.1 billion). The number of persons aged 80 years or older is expected to triple between 2020 and 2050 to reach 426 million.
Additionally, According to NCOA research, nearly 95% of adults 60 and older have at least one chronic condition, while nearly 80% have two or more. And, according to the WHO, the incidence of cancer rises dramatically at a later stage in life. In fact, in 2022 about 53% of people who had cancer were 65 or older. AI-powered imaging has proven to be effective in early detection of cancers like breast cancer, lung cancer and prostate cancer conditions that are more prevalent in older adults.
Data privacy and security concerns
Data privacy and security concerns are significant challenges that are hampering the growth of the AI-enabled medical imaging solutions market. These concerns primarily arise due to the sensitive nature of medical data, the complexity of AI systems and the increasing incidents of cyberattacks targeting healthcare organizations.
Medical imaging data, such as MRI scans, CT scans and X-rays, contains highly sensitive personal health information. This data is often stored in cloud-based systems or transmitted over networks for AI analysis, making it vulnerable to unauthorized access. If sensitive patient data is compromised, it not only jeopardizes individual privacy but also damages the reputation of healthcare providers and AI vendors, potentially leading to loss of patient trust and reduced adoption of AI technologies.
For instance, a Colorado-based pathology laboratory is notifying more than 1.8 million patients that their sensitive information was compromised one of the largest breaches reported by a medical testing lab to US federal regulators, making the healthcare industry especially vulnerable to hackers.
Segment Analysis
The global AI-enabled medical imaging solutions market is segmented based on imaging modality, deployment mode, application, end-user and region.
Application:
The oncology segment is expected to dominate the global AI-enabled medical imaging solutions market share
The oncology segment holds a major portion of the AI-enabled medical imaging solutions market share and is expected to continue to hold a significant portion of the market share over the forecast period. his dominance is primarily driven by the critical need for early cancer detection, improved diagnostic accuracy and the growing adoption of AI technologies in oncology diagnostics.
Cancer is one of the leading causes of death worldwide. According to the World Health Organization (WHO), nearly 10 million people die from cancer each year. As cancer rates increase globally, the demand for effective diagnostic tools, including AI-powered medical imaging solutions, rises.
Early detection is crucial in improving cancer survival rates. AI has shown its potential to enhance the accuracy and speed of detecting cancers at an early stage. AI-enabled imaging solutions can analyze medical images (such as CT scans, MRIs, and mammograms) for early signs of cancer, enabling more effective and timely treatment.
For instance, the Harvard University team tested the AI tool, CHIEF (Clinical Histopathology Imaging Evaluation Foundation) performance on more than 19,400 whole-slide images from 32 independent datasets collected from 24 hospitals and patient cohorts across the globe. CHIEF achieved nearly 94 percent accuracy in cancer detection and significantly outperformed current AI approaches across 15 datasets containing 11 cancer types.
North America is expected to hold a significant position in the global AI-enabled medical imaging solutions market
North America region is expected to hold the largest market share over the forecast period. North America, particularly the United States and Canada, has some of the most advanced healthcare systems globally. These systems have the infrastructure and resources needed to implement and scale AI-driven medical imaging solutions.
For instance, the U.S. healthcare market is one of the largest in the world, with healthcare spending grew 4.1 percent in 2022, reaching $4.5 trillion or $13,493 per person, according to the Centers for Medicare & Medicaid Services (CMS). This substantial investment supports the adoption of cutting-edge technologies like AI in medical imaging to improve diagnostic accuracy and efficiency.
North America especially in the United States, is a global leader in artificial intelligence innovation, with tech giants heavily involved in the development of AI technologies for healthcare applications, including medical imaging. For instance, in April 2023, Exo cleared its FDA-cleared cardiac and lung artificial intelligence (AI) applications are available on Exo Iris, Exo’s high-performance handheld ultrasound device. With affordable, AI-powered medical imaging in a pocket-sized device, caregivers can get answers immediately to accelerate diagnosis and create new care pathways for heart failure patients at the point of care.
Asia Pacific is growing at the fastest pace in the AI-enabled medical imaging solutions market
The Asia Pacific region is experiencing the fastest growth in the AI-enabled medical imaging solutions market. The Asia Pacific region is home to 60% of the world’s population, with over 4.3 billion people. This large and diverse population presents a significant demand for healthcare services, including advanced diagnostic solutions like AI-powered medical imaging. As the population grows, so does the prevalence of health conditions such as cancer, cardiovascular diseases and neurological disorders, driving the demand for AI-powered diagnostic tools to help healthcare providers manage these conditions more effectively.
For instance, China and India, with populations over 1.4 billion and 1.4 billion respectively, are seeing a rise in diseases like lung cancer and diabetes, which are major drivers for the adoption of AI medical imaging tools in early detection and diagnosis.
Asia-Pacific countries are seeing a significant rise in chronic diseases, such as cancer, cardiovascular diseases and diabetes, necessitating the adoption of advanced diagnostic tools like AI-driven imaging to detect these diseases in their early stages. For instance, India has seen a rising incidence of cancer, with the Indian Council of Medical Research (ICMR) estimating that cancer cases will increase by more than 25% by 2035, highlighting the demand for AI-enabled imaging solutions for early diagnosis.
Competitive Landscape
The major global players in the AI-enabled medical imaging solutions market include deepc GmbH, Qure.ai Technologies Private Limited, DeepTek.ai, Inc, Aidoc, Tempus AI, Inc., Rayscape, Infervision, AIKENIST, Rad AI, Brainomix Limited and among others.
Why Purchase the Report?
• Pipeline & Innovations: Reviews ongoing clinical trials, product pipelines, and forecasts upcoming advancements in medical devices and pharmaceuticals.
• Product Performance & Market Positioning: Analyzes product performance, market positioning, and growth potential to optimize strategies.
• Real-World Evidence: Integrates patient feedback and data into product development for improved outcomes.
• Physician Preferences & Health System Impact: Examines healthcare provider behaviors and the impact of health system mergers on adoption strategies.
• Market Updates & Industry Changes: Covers recent regulatory changes, new policies, and emerging technologies.
• Competitive Strategies: Analyzes competitor strategies, market share, and emerging players.
• Pricing & Market Access: Reviews pricing models, reimbursement trends, and market access strategies.
• Market Entry & Expansion: Identifies optimal strategies for entering new markets and partnerships.
• Regional Growth & Investment: Highlights high-growth regions and investment opportunities.
• Supply Chain Optimization: Assesses supply chain risks and distribution strategies for efficient product delivery.
• Sustainability & Regulatory Impact: Focuses on eco-friendly practices and evolving regulations in healthcare.
• Post-market Surveillance: Uses post-market data to enhance product safety and access.
• Pharmacoeconomics & Value-Based Pricing: Analyzes the shift to value-based pricing and data-driven decision-making in R&D.
The global artificial organs and bionics market report delivers a detailed analysis with 60+ key tables, more than 50 visually impactful figures, and 176 pages of expert insights, providing a complete view of the market landscape.
Target Audience 2023
• Manufacturers: Pharmaceutical, Medical Device, Biotech Companies, Contract Manufacturers, Distributors, Hospitals.
• Regulatory & Policy: Compliance Officers, Government, Health Economists, Market Access Specialists.
• Technology & Innovation: AI/Robotics Providers, R&D Professionals, Clinical Trial Managers, Pharmacovigilance Experts.
• Investors: Healthcare Investors, Venture Fund Investors, Pharma Marketing & Sales.
• Consulting & Advisory: Healthcare Consultants, Industry Associations, Analysts.
• Supply Chain: Distribution and Supply Chain Managers.
• Consumers & Advocacy: Patients, Advocacy Groups, Insurance Companies.
• Academic & Research: Academic Institutions.
1. Methodology and Scope
1.1. Research Methodology
1.2. Research Objective and Scope of the Report
2. Definition and Overview
3. Executive Summary
3.1. Snippet by Imaging Modality
3.2. Snippet by Deployment Mode
3.3. Snippet by Application
3.4. Snippet by End-User
3.5. Snippet by Region
4. Dynamics
4.1. Impacting Factors
4.1.1. Drivers
4.1.1.1. Rising Aging Population
4.1.1.2. Rapid Analysis and Decision Making
4.1.2. Restraints
4.1.2.1. Data Privacy and Security Concerns
4.1.3. Opportunity
4.1.4. Impact Analysis
5. Industry Analysis
5.1. Porter’s Five Force Analysis
5.2. Supply Chain Analysis
5.3. Pricing Analysis
5.4. Patent Analysis
5.5. Regulatory Analysis
5.6. SWOT Analysis
5.7. Unmet Needs
6. By Imaging Modality
6.1. Introduction
6.1.1. Market Size Analysis and Y-o-Y Growth Analysis (%), By Imaging Modality
6.1.2. Market Attractiveness Index, By Imaging Modality
6.2. X-ray Imaging*
6.2.1. Introduction
6.2.2. Market Size Analysis and Y-o-Y Growth Analysis (%)
6.3. Magnetic Resonance Imaging (MRI)
6.4. Computed Tomography (CT)
6.5. Ultrasound Imaging
6.6. Mammography
6.7. Others
7. By Deployment Mode
7.1. Introduction
7.1.1. Market Size Analysis and Y-o-Y Growth Analysis (%), By Deployment Mode
7.1.2. Market Attractiveness Index, By Deployment Mode
7.2. Cloud-Based Solutions*
7.2.1. Introduction
7.2.2. Market Size Analysis and Y-o-Y Growth Analysis (%)
7.3. On-Premise Solutions
7.4. Hybrid Models
8. By Application
8.1. Introduction
8.1.1. Market Size Analysis and Y-o-Y Growth Analysis (%), By Application
8.1.2. Market Attractiveness Index, By Application
8.2. Oncology*
8.2.1. Introduction
8.2.2. Market Size Analysis and Y-o-Y Growth Analysis (%)
8.3. Cardiology
8.4. Neurology
8.5. Respiratory Disorders
8.6. Orthopedics
8.7. Gastroenterology
8.8. Others
9. By End-User
9.1. Introduction
9.1.1. Market Size Analysis and Y-o-Y Growth Analysis (%), By End-User
9.1.2. Market Attractiveness Index, By End-User
9.2. Hospitals*
9.2.1. Introduction
9.2.2. Market Size Analysis and Y-o-Y Growth Analysis (%)
9.3. Diagnostic Centers
9.4. Specialty Clinics
9.5. Academic and Research Institutes
10. By Region
10.1. Introduction
10.1.1. Market Size Analysis and Y-o-Y Growth Analysis (%), By Region
10.1.2. Market Attractiveness Index, By Region
10.2. North America
10.2.1. Introduction
10.2.2. Key Region-Specific Dynamics
10.2.3. Market Size Analysis and Y-o-Y Growth Analysis (%), By Imaging Modality
10.2.4. Market Size Analysis and Y-o-Y Growth Analysis (%), By Deployment Mode
10.2.5. Market Size Analysis and Y-o-Y Growth Analysis (%), By Application
10.2.6. Market Size Analysis and Y-o-Y Growth Analysis (%), By End-User
10.2.7. Market Size Analysis and Y-o-Y Growth Analysis (%), By Country
10.2.7.1. U.S.
10.2.7.2. Canada
10.2.7.3. Mexico
10.3. Europe
10.3.1. Introduction
10.3.2. Key Region-Specific Dynamics
10.3.3. Market Size Analysis and Y-o-Y Growth Analysis (%), By Imaging Modality
10.3.4. Market Size Analysis and Y-o-Y Growth Analysis (%), By Deployment Mode
10.3.5. Market Size Analysis and Y-o-Y Growth Analysis (%), By Application
10.3.6. Market Size Analysis and Y-o-Y Growth Analysis (%), By End-User
10.3.7. Market Size Analysis and Y-o-Y Growth Analysis (%), By Country
10.3.7.1. Germany
10.3.7.2. U.K.
10.3.7.3. France
10.3.7.4. Spain
10.3.7.5. Italy
10.3.7.6. Rest of Europe
10.4. South America
10.4.1. Introduction
10.4.2. Key Region-Specific Dynamics
10.4.3. Market Size Analysis and Y-o-Y Growth Analysis (%), By Imaging Modality
10.4.4. Market Size Analysis and Y-o-Y Growth Analysis (%), By Deployment Mode
10.4.5. Market Size Analysis and Y-o-Y Growth Analysis (%), By Application
10.4.6. Market Size Analysis and Y-o-Y Growth Analysis (%), By End-User
10.4.7. Market Size Analysis and Y-o-Y Growth Analysis (%), By Country
10.4.7.1. Brazil
10.4.7.2. Argentina
10.4.7.3. Rest of South America
10.5. Asia-Pacific
10.5.1. Introduction
10.5.2. Key Region-Specific Dynamics
10.5.3. Market Size Analysis and Y-o-Y Growth Analysis (%), By Imaging Modality
10.5.4. Market Size Analysis and Y-o-Y Growth Analysis (%), By Deployment Mode
10.5.5. Market Size Analysis and Y-o-Y Growth Analysis (%), By Application
10.5.6. Market Size Analysis and Y-o-Y Growth Analysis (%), By End-User
10.5.7. Market Size Analysis and Y-o-Y Growth Analysis (%), By Country
10.5.7.1. China
10.5.7.2. India
10.5.7.3. Japan
10.5.7.4. South Korea
10.5.7.5. Rest of Asia-Pacific
10.6. Middle East and Africa
10.6.1. Introduction
10.6.2. Key Region-Specific Dynamics
10.6.3. Market Size Analysis and Y-o-Y Growth Analysis (%), By Imaging Modality
10.6.4. Market Size Analysis and Y-o-Y Growth Analysis (%), By Deployment Mode
10.6.5. Market Size Analysis and Y-o-Y Growth Analysis (%), By Application
10.6.6. Market Size Analysis and Y-o-Y Growth Analysis (%), By End-User
11. Competitive Landscape
11.1. Competitive Scenario
11.2. Market Positioning/Share Analysis
11.3. Mergers and Acquisitions Analysis
12. Company Profiles
12.1. deepc GmbH*
12.1.1. Company Overview
12.1.2. Product Portfolio and Description
12.1.3. Financial Overview
12.1.4. Key Developments
12.2. Qure.ai Technologies Private Limited
12.3. DeepTek.ai, Inc
12.4. Aidoc
12.5. Tempus AI, Inc.
12.6. Rayscape
12.7. Infervision
12.8. AIKENIST
12.9. Rad AI
12.10. Brainomix Limited
LIST NOT EXHAUSTIVE
13. Appendix
13.1. About Us and Services
13.2. Contact Us
| ※参考情報 AI搭載医療用画像ソリューションは、人工知能技術を活用して医療用画像の解析、診断、処理を行うためのシステムです。これにより、医師はより迅速かつ正確に患者の状態を評価できるようになります。近年、医療業界におけるAIの導入が進んできた結果、さまざまな種類の画像ソリューションが開発され、日常診療や研究に幅広く用いられるようになっています。 まず、AI搭載医療用画像ソリューションには、主に以下のような種類があります。1つ目は、画像認識技術を用いた診断支援システムです。これは、X線、CT、MRIなどの医療画像をAIが解析し、病変や異常の有無を特定します。2つ目は、画像生成技術です。これには、生成的敵対ネットワーク(GAN)などを使用し、画像の補完や合成を行うソリューションが含まれます。これにより、診断の精度向上や、より多様なデータセットの構築が可能になります。3つ目は、画像処理技術です。これには、ノイズ除去や強調処理、三次元再構築などが含まれ、医師が解析しやすい形に画像を整える役割を果たします。 次に、これらのソリューションの主な用途について説明します。AI搭載医療用画像ソリューションは、主に診断支援に使用されます。例えば、肺がんや乳がんの早期発見において、AIが画像を解析し、腫瘍の兆候を見つけることができます。また、心血管疾患のリスク評価では、心臓の構造や血管の状態をAIが分析することで、患者の健康状態をより深く理解する手助けができます。 さらに、AIは特定の疾患の予測にも活用されています。例えば、糖尿病性網膜症やアルツハイマー病の早期発見において、AIが患者の医療画像と過去のデータを解析することで、発症のリスクを予測し、適切な措置を講じることができます。また、臨床試験や研究にも使われており、治療法の開発や新たな診断基準の確立に貢献しています。 AI搭載医療用画像ソリューションに関連する技術には、機械学習や深層学習が含まれます。これらの技術は、大量の医療画像データを元に、特徴を学習し、パターンを識別する能力を持っています。特に、深層学習は多層のニューラルネットワークを使用して画像を解析し、従来の手法では捉えきれなかった微細な変化や異常を把握することが可能です。 さらに、AI技術の発展により、スーパーバイザードラーニングやアンスーパーリング技術も使用されるようになっています。これにより、教師データに基づいた学習が行われる場合でも、ラベル付けが難しい画像データからも価値のある情報を引き出すことができるようになっています。また、AIのエッジコンピューティング技術を利用すれば、リアルタイムでの画像解析が可能となり、迅速な対応が求められる医療現場においても利用価値が高まります。 最後に、AI搭載医療用画像ソリューションは、医療従事者の負担軽減だけでなく、患者の診断精度向上にも寄与しています。これにより、患者の早期治療や適切な治療法の選択が可能となり、最終的には健康寿命の延伸に繋がります。 これからもAI技術の進化が期待され、医療用画像ソリューションのさらなる発展が見込まれます。データのセキュリティやプライバシー保護の観点からも、技術の進歩とともに新しい課題が生まれることは確実であり、これらを解決するための研究や取り組みが求められています。このように、AI搭載医療用画像ソリューションは、医療の未来を切り拓く重要な要素となることでしょう。 |
*** AI搭載医療用画像ソリューションの世界市場に関するよくある質問(FAQ) ***
・AI搭載医療用画像ソリューションの世界市場規模は?
→DataM Intelligence社は2023年のAI搭載医療用画像ソリューションの世界市場規模を11億2000万米ドルと推定しています。
・AI搭載医療用画像ソリューションの世界市場予測は?
→DataM Intelligence社は2031年のAI搭載医療用画像ソリューションの世界市場規模を126億4000万米ドルと予測しています。
・AI搭載医療用画像ソリューション市場の成長率は?
→DataM Intelligence社はAI搭載医療用画像ソリューションの世界市場が2024年~2031年に年平均35.6%成長すると展望しています。
・世界のAI搭載医療用画像ソリューション市場における主要プレイヤーは?
→「deepc GmbH、Qure.ai Technologies Private Limited、DeepTek.ai, Inc、Aidoc、Tempus AI, Inc.、Rayscape、Infervision、AIKENIST、Rad AI、Brainomix Limitedなど ...」をAI搭載医療用画像ソリューション市場のグローバル主要プレイヤーとして判断しています。
※上記FAQの市場規模、市場予測、成長率、主要企業に関する情報は本レポートの概要を作成した時点での情報であり、最終レポートの情報と少し異なる場合があります。
*** 免責事項 ***
https://www.globalresearch.co.jp/disclaimer/









